Free Access
Fig. 4
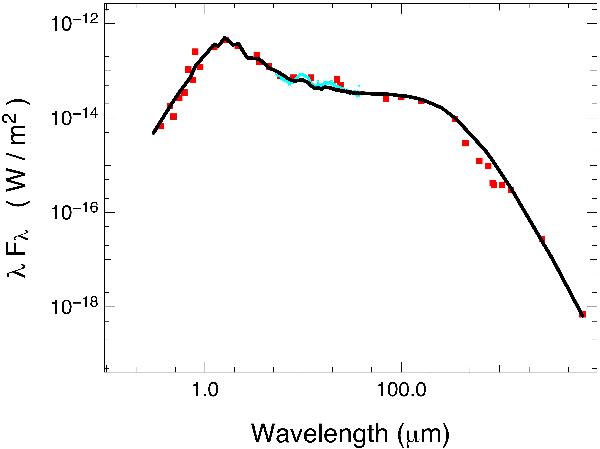
SED predicted by MCFOST using the input parameters listed in Table 9 (black solid line) overplotted on the observed photometric points (red dots). The blue spectrum is the Spitzer/IRS spectrum.
Current usage metrics show cumulative count of Article Views (full-text article views including HTML views, PDF and ePub downloads, according to the available data) and Abstracts Views on Vision4Press platform.
Data correspond to usage on the plateform after 2015. The current usage metrics is available 48-96 hours after online publication and is updated daily on week days.
Initial download of the metrics may take a while.