Free Access
Fig. 3
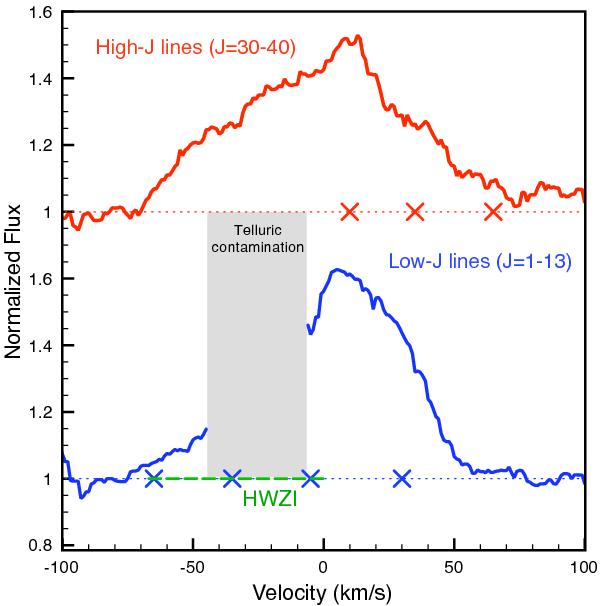
Average profiles of the CO ν = 1−0 high-J (red line) and low-J (blue line) ro-vibrational lines. The green dashed line indicates the (HWZI)obs of the lines. The red and blue crosses indicate the position of ν = 2−1 blended lines.
Current usage metrics show cumulative count of Article Views (full-text article views including HTML views, PDF and ePub downloads, according to the available data) and Abstracts Views on Vision4Press platform.
Data correspond to usage on the plateform after 2015. The current usage metrics is available 48-96 hours after online publication and is updated daily on week days.
Initial download of the metrics may take a while.