Fig. 7
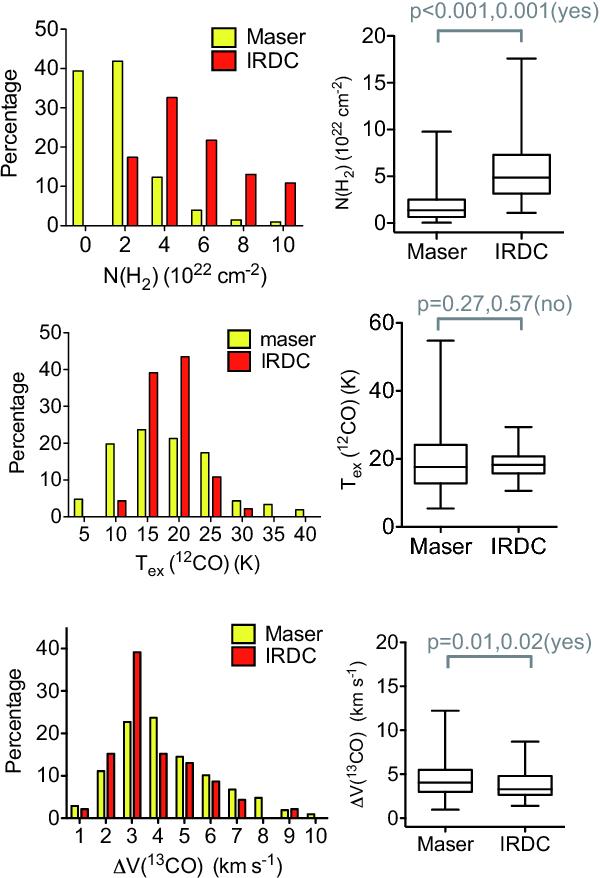
Comparison of the physical parameters in our maser sources and the IRDCs (Du & Yang 2008). The left panels show the parameter distribution in each interval. The right panels show the overall statistics. For each data set, the whiskers represent the overall distribution; and the box and its inner segment represent the 25% to 75% range and the median value, respectively.
Current usage metrics show cumulative count of Article Views (full-text article views including HTML views, PDF and ePub downloads, according to the available data) and Abstracts Views on Vision4Press platform.
Data correspond to usage on the plateform after 2015. The current usage metrics is available 48-96 hours after online publication and is updated daily on week days.
Initial download of the metrics may take a while.