Fig. 3
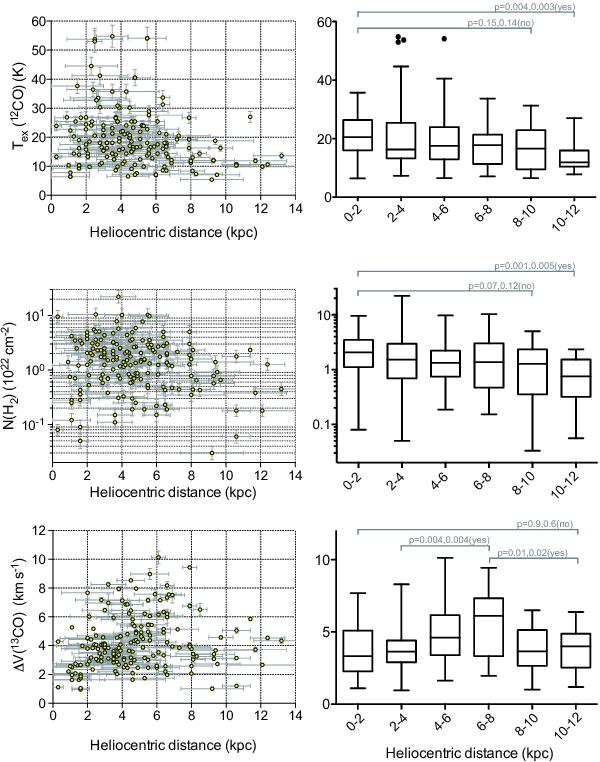
Distribution of the physical parameters with the heliocentric distance. Left panels: all the data points. Right panels: statistical box plots for the data distribution in each 2-kpc interval. The dots represent the outliers, which are apparently isolated from the major fraction of the data points. For each statistical box, the entire whisker represents the overall distribution. If there are isolated data points (based on eye selection), the whisker then represents the remaining data range. The box and its inner segment represent the 25% to 75% range and the median value, respectively. We selected interval pairs, which may typically reflect the variation trend. The interval pairs are indicated with gray segments above the whiskers. Labeled on the segment are the p values from the t test and M-W test respectively, and the test result (“yes” or “no” in the brackets) for whether the two intervals have significantly different distributions.
Current usage metrics show cumulative count of Article Views (full-text article views including HTML views, PDF and ePub downloads, according to the available data) and Abstracts Views on Vision4Press platform.
Data correspond to usage on the plateform after 2015. The current usage metrics is available 48-96 hours after online publication and is updated daily on week days.
Initial download of the metrics may take a while.