Fig. 2
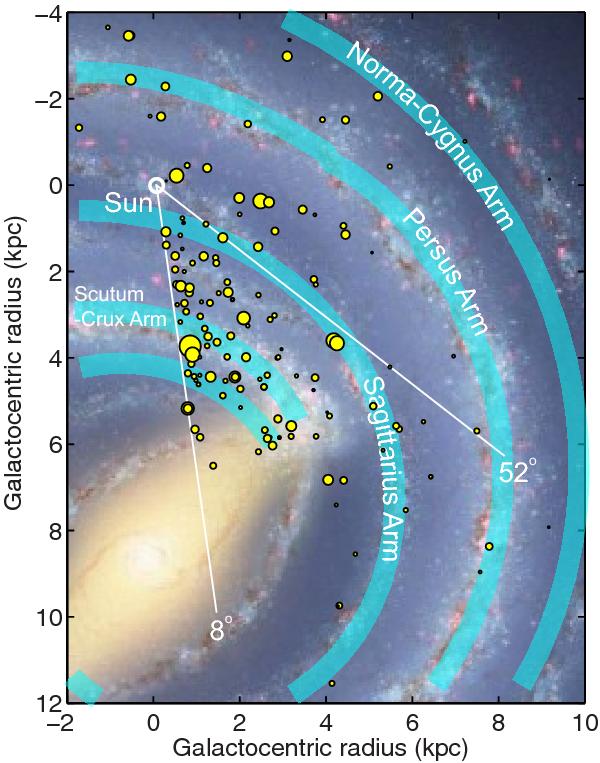
Distribution of our observed sources on the Milky Way disk. The source sizes are proportional to their  line intensity. The thick faint blue lines represent the distribution of the spiral arms (Russeil 2003) in our observed field. The background image is the artist’s view of the Galactic morphology (R. Hurt: NASA/JPL-Caltech/SSC, with a more detailed introduction in Urquhart et al. 2011).
Current usage metrics show cumulative count of Article Views (full-text article views including HTML views, PDF and ePub downloads, according to the available data) and Abstracts Views on Vision4Press platform.
Data correspond to usage on the plateform after 2015. The current usage metrics is available 48-96 hours after online publication and is updated daily on week days.
Initial download of the metrics may take a while.