Free Access
Fig. A.3
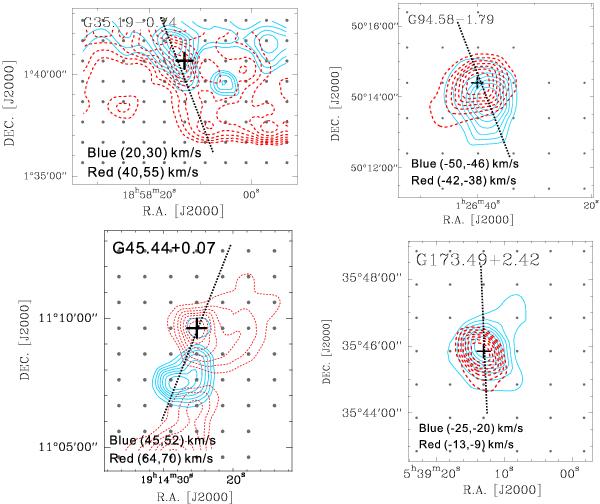
Outflow emissions. The solid blue and dashed red contours indicate the blue- and red-shifted emissions, respectively. The dashed line in each panel indicates the speculated outflow orientation. The velocity ranges for the integration are shown in each panel. The black cross indicates the central position (maser source).
Current usage metrics show cumulative count of Article Views (full-text article views including HTML views, PDF and ePub downloads, according to the available data) and Abstracts Views on Vision4Press platform.
Data correspond to usage on the plateform after 2015. The current usage metrics is available 48-96 hours after online publication and is updated daily on week days.
Initial download of the metrics may take a while.