Fig. A.2
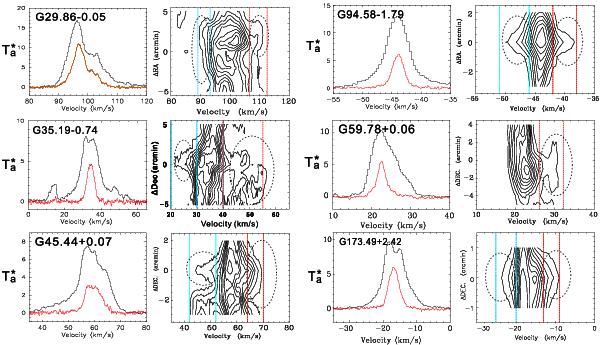
CO spectra ( in black and
  in red) at the mapping point closest to the core center and position–velocity diagrams of the outflow candidates. The dashed lines indicate the velocity ranges adopted as the line wings for the four sources (G59.78 only has evident red wings). The swelled line wings that may indicate the outflow are also encircled with the dashed ellipses.
Current usage metrics show cumulative count of Article Views (full-text article views including HTML views, PDF and ePub downloads, according to the available data) and Abstracts Views on Vision4Press platform.
Data correspond to usage on the plateform after 2015. The current usage metrics is available 48-96 hours after online publication and is updated daily on week days.
Initial download of the metrics may take a while.