Fig. 1
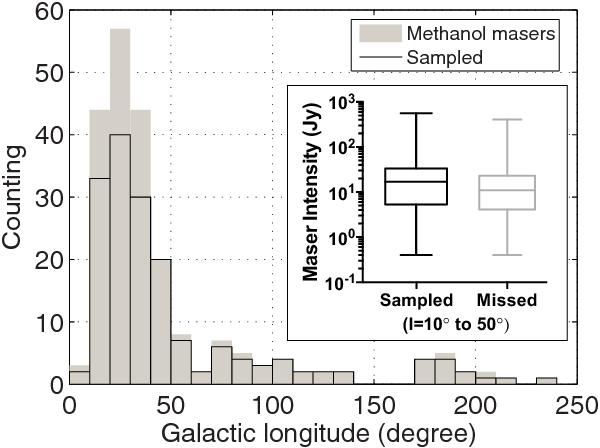
Number of sources in each 10-degree Galactic longitude interval. The gray and black-line columns represent the full sample of the methanol masers (Pestalozzi et al. 2005) and the fraction covered by our sample, respectively. Overlaid inset panel: distributions of the maser intensities for the sampled and missed sources in l = 10° to 50° range. For each statistical box, the entire error bar (whisker) represents the overall distribution, the box and its inner segment represent the 25% to 75% range and the median value, respectively.
Current usage metrics show cumulative count of Article Views (full-text article views including HTML views, PDF and ePub downloads, according to the available data) and Abstracts Views on Vision4Press platform.
Data correspond to usage on the plateform after 2015. The current usage metrics is available 48-96 hours after online publication and is updated daily on week days.
Initial download of the metrics may take a while.