Fig. 2
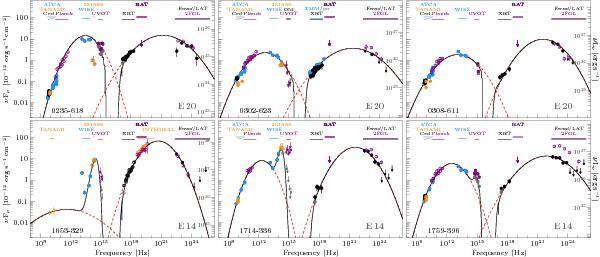
Broadband SEDs for the six TANAMI blazars. Filled data points are from the IceCube integration period (May 2010–May 2012), open circles are archival data outside the time period. Gray shows the absorbed (X-ray) and reddened (optical/UV) spectra. The data have been parametrized with logarithmic parabolas (dashed red lines) modified by extinction and absorption, as well as by an additional blackbody component where necessary (solid black lines).
Current usage metrics show cumulative count of Article Views (full-text article views including HTML views, PDF and ePub downloads, according to the available data) and Abstracts Views on Vision4Press platform.
Data correspond to usage on the plateform after 2015. The current usage metrics is available 48-96 hours after online publication and is updated daily on week days.
Initial download of the metrics may take a while.