Fig. 1
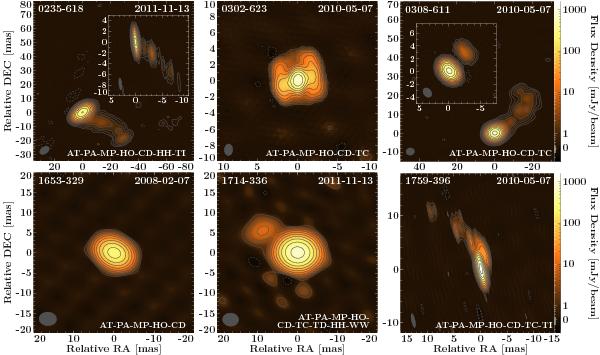
VLBI images at 8.4 GHz (natural weighting for insets of 0235−618 and 0308−611 and all other images; tapered to 10% at 100 Mλ for main panels of 0235−618 and 0308−611). Restoring beams are shown in the bottom left corners. The color scale covers the range between the mean noise level and the maximum flux density (1759−396, see Table 2 for image parameters). Contour lines start at 3σrms and increase logarithmically by factors of 2. The array is given in the bottom right corner: PA: Parkes, AT: ATCA, MP: Mopra, HO: Hobart, CD: Ceduna, HH: Hartebeesthoek, TC: TIGO, TI: Tidbinbilla (70 m), TD: Tidbinbilla (34 m), WW:Warkworth
Current usage metrics show cumulative count of Article Views (full-text article views including HTML views, PDF and ePub downloads, according to the available data) and Abstracts Views on Vision4Press platform.
Data correspond to usage on the plateform after 2015. The current usage metrics is available 48-96 hours after online publication and is updated daily on week days.
Initial download of the metrics may take a while.