Fig. 2
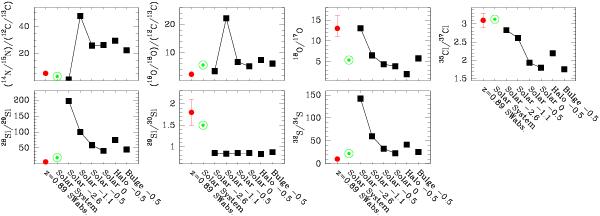
Comparison of the isotopic ratios of C, N, O, S, Si, and Cl measured at z = 0.89 toward PKS 1830−211(SW) (Muller et al. 2006, 2011, 2013 and this work) and in the solar system (solar symbols in green, Lodders 2003), and predictions from evolution models from Kobayashi et al. (2011) (black squares) for the solar neighbourhood (solar, at [Fe/H]=−2.6, −1.1, and −0.5), and halo and bulge at [Fe/H]=−0.5. The 14N/15N and 16O/18O ratios are normalized by the 12C/13C ratio, because of the difficulties of measuring all three separately in the z = 0.89 absorber toward PKS 1830−211.
Current usage metrics show cumulative count of Article Views (full-text article views including HTML views, PDF and ePub downloads, according to the available data) and Abstracts Views on Vision4Press platform.
Data correspond to usage on the plateform after 2015. The current usage metrics is available 48-96 hours after online publication and is updated daily on week days.
Initial download of the metrics may take a while.