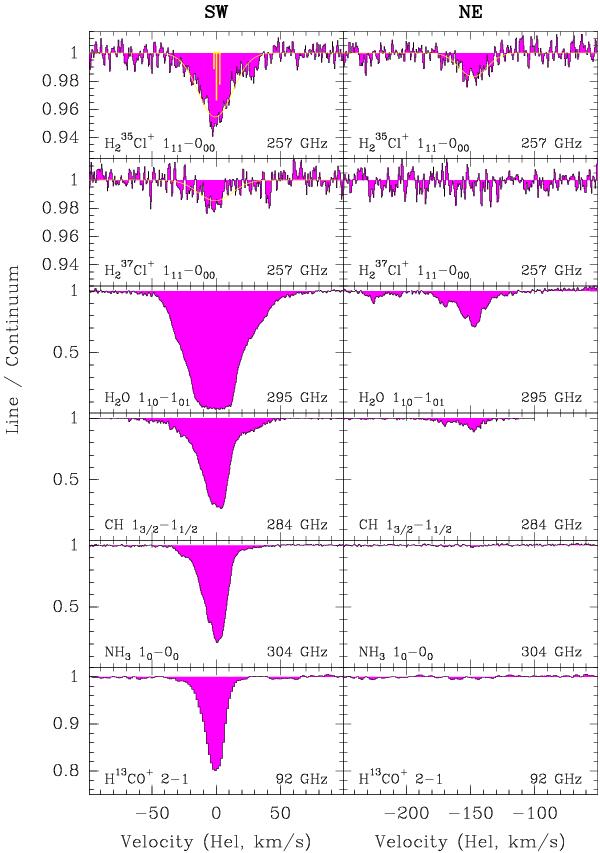
Fig. 1
Spectra of the H Cl+ and
H
Cl+ and
H Cl+ 111-000 (para) line and other
species, all observed by ALMA between April and June 2012, toward the
PKS 1830−211 SW image
(left) and the NE image (right). The hyperfine
structure for the HCl+ para-line is shown
(top-left). That for HCl+ is similar. The Gaussian
fits are overlaid in light yellow. The redshifted line frequency is given in the
bottom-right corner of each box. A detailed presentation of the
ALMA data is given by Muller et al. (2014).
Cl+ 111-000 (para) line and other
species, all observed by ALMA between April and June 2012, toward the
PKS 1830−211 SW image
(left) and the NE image (right). The hyperfine
structure for the HCl+ para-line is shown
(top-left). That for HCl+ is similar. The Gaussian
fits are overlaid in light yellow. The redshifted line frequency is given in the
bottom-right corner of each box. A detailed presentation of the
ALMA data is given by Muller et al. (2014).
Current usage metrics show cumulative count of Article Views (full-text article views including HTML views, PDF and ePub downloads, according to the available data) and Abstracts Views on Vision4Press platform.
Data correspond to usage on the plateform after 2015. The current usage metrics is available 48-96 hours after online publication and is updated daily on week days.
Initial download of the metrics may take a while.