Fig. 3
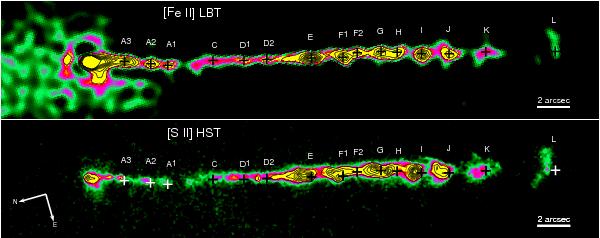
[Fe ii] 1.64 μm deconvolved image of the entire HH34 jet is shown in comparison with the HST image in [S ii] at 6716+6730 Å. Both images are rotated for a better comparison. Crosses mark the peaks of the emission knots detected in the [Fe ii] image. The same positions are reported on the [S ii] image to make evident the shifts due to the jet proper motion.
Current usage metrics show cumulative count of Article Views (full-text article views including HTML views, PDF and ePub downloads, according to the available data) and Abstracts Views on Vision4Press platform.
Data correspond to usage on the plateform after 2015. The current usage metrics is available 48-96 hours after online publication and is updated daily on week days.
Initial download of the metrics may take a while.