Free Access
Fig. 2
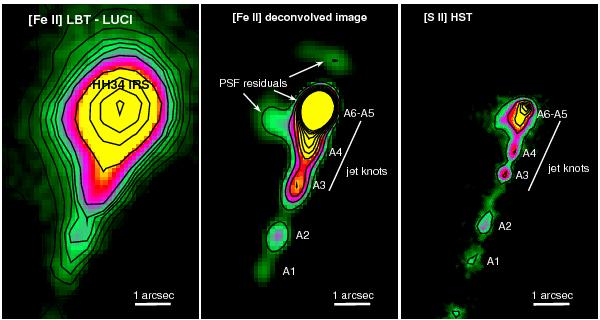
[Fe ii] 1.64 μm image of the central HH34 region. The left and middle panels show the original image and the image deconvolved by adopting the algorithm described in La Camera et al. (2014), respectively. In the right panel, a HST image in [S ii] at 6716+6730 Å taken in 2007 is shown for comparison (Hartigan et al. 2011).
Current usage metrics show cumulative count of Article Views (full-text article views including HTML views, PDF and ePub downloads, according to the available data) and Abstracts Views on Vision4Press platform.
Data correspond to usage on the plateform after 2015. The current usage metrics is available 48-96 hours after online publication and is updated daily on week days.
Initial download of the metrics may take a while.