Fig. 5
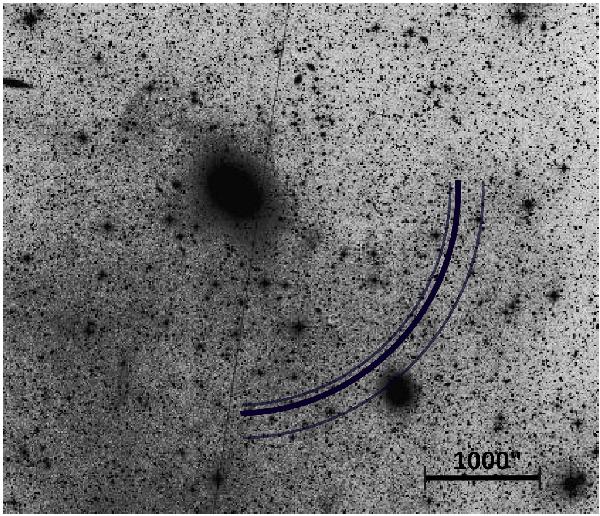
Position of the predicted shell in NGC 3923. The thick middle arc is the most probable position of the predicted shell (calculated for the mass distribution used in Bílek et al. 2013). The inner and the outer arcs present the error range deduced as the lowest and highest values in Table 1 excluding the point mass potentials. The data for the underlying image are taken from the Digitized Sky Survey.
Current usage metrics show cumulative count of Article Views (full-text article views including HTML views, PDF and ePub downloads, according to the available data) and Abstracts Views on Vision4Press platform.
Data correspond to usage on the plateform after 2015. The current usage metrics is available 48-96 hours after online publication and is updated daily on week days.
Initial download of the metrics may take a while.