Free Access
Fig. 21
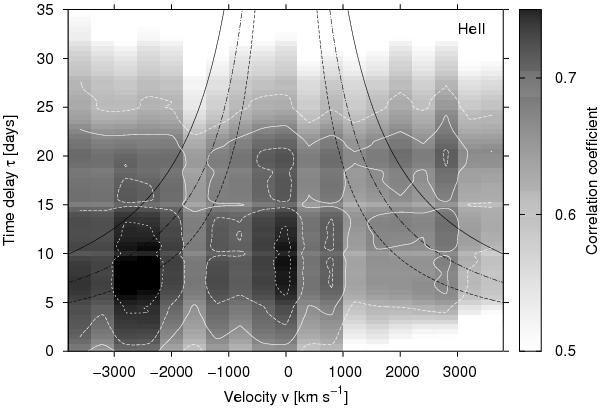
2D CCF(τ,v) showing the correlation of the He ii λ4686 line segment light curves with the continuum light curve as a function of velocity and time delay (gray scale). Contours of the correlation coefficients are overplotted at levels of 0.72, 0.68, 0.64, 0.59 (white lines). Black curves as in Fig. 17.
Current usage metrics show cumulative count of Article Views (full-text article views including HTML views, PDF and ePub downloads, according to the available data) and Abstracts Views on Vision4Press platform.
Data correspond to usage on the plateform after 2015. The current usage metrics is available 48-96 hours after online publication and is updated daily on week days.
Initial download of the metrics may take a while.