Free Access
Fig. 2
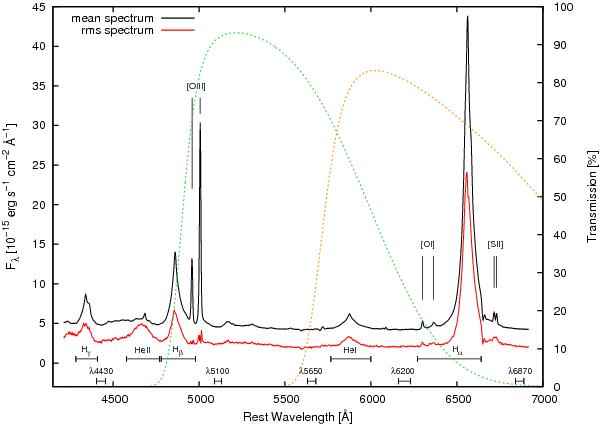
Integrated mean (black) and rms (red) spectra of 3C 120. The rms spectrum has been scaled by a factor of 10 (the zero level is shifted by − 2.5) to enhance weaker line structures. Overplotted are V (green) and R (orange) band filter curves. We also used these filters to generate the continuum light-curves.
Current usage metrics show cumulative count of Article Views (full-text article views including HTML views, PDF and ePub downloads, according to the available data) and Abstracts Views on Vision4Press platform.
Data correspond to usage on the plateform after 2015. The current usage metrics is available 48-96 hours after online publication and is updated daily on week days.
Initial download of the metrics may take a while.