Fig. 8
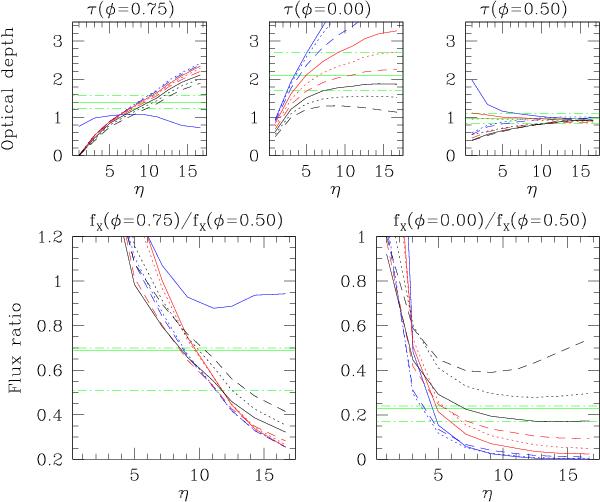
Output from the toy model for the three optical depths (top panels) and the two flux ratios (bottom panels). The green horizontal lines yield the observed values and their error bars. The blue lines correspond to inclinations of 90, 85 and 80° for the solid, dotted, and dashed lines, respectively. The solid, dotted, and dashed red and black lines yield in turn the results for inclinations of 75, 70, 65°, and 60, 55, 50°, respectively. The model adopted here uses the opacities from Model 2 and assumes Ṁ1 = 1.87 × 10⁻⁶ M⊙ yr-1, v∞,1 = 2245 km s-1, rmax = 0.75 a.
Current usage metrics show cumulative count of Article Views (full-text article views including HTML views, PDF and ePub downloads, according to the available data) and Abstracts Views on Vision4Press platform.
Data correspond to usage on the plateform after 2015. The current usage metrics is available 48-96 hours after online publication and is updated daily on week days.
Initial download of the metrics may take a while.