Fig. 9
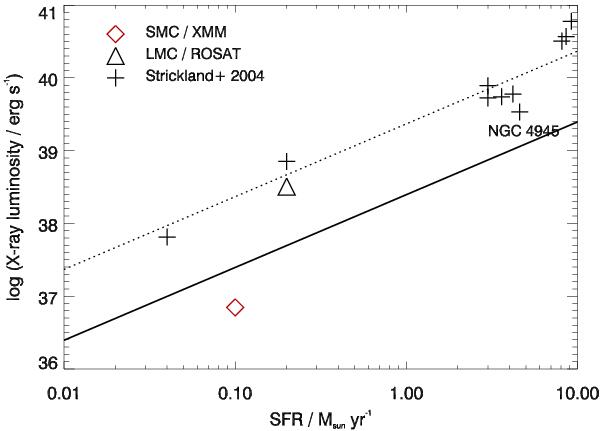
Diffuse X-ray luminosity in the 0.2–2 keV band versus star formation rate in nearby galaxies. Black plus signs are data from Strickland et al. (2004a) for a sample of nearby galaxies with alargerange of star-formation properties. The black triangle shows the ROSAT measurement of the LMC form Sasaki et al. (2002). The result from XMM-Newton survey of the SMC (Sturm 2012; Sturm et al. 2013) is indicated by the red diamond. The dotted line is a fit to the Strickland et al. data. The source which is furthest below this line (NGC 4945) is marked. The solid line is the prediction from our analysis for solar metallicity. It is below the fit line for the Strickland et al. data by a factor of 9, which would decrease to 6 if the 0.1–0.2 keV band would be added. For the SMC metallicity, the prediction would be lower by a factor of ten. See Sect. 5 for possible explanations for the discrepancy.
Current usage metrics show cumulative count of Article Views (full-text article views including HTML views, PDF and ePub downloads, according to the available data) and Abstracts Views on Vision4Press platform.
Data correspond to usage on the plateform after 2015. The current usage metrics is available 48-96 hours after online publication and is updated daily on week days.
Initial download of the metrics may take a while.