Fig. 8
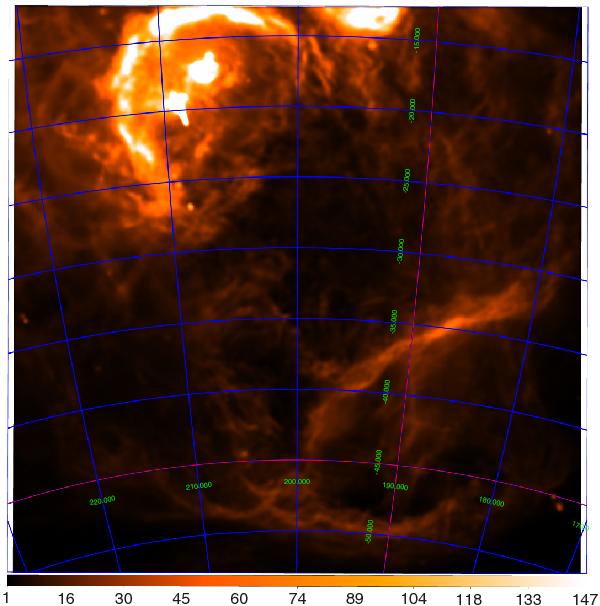
Hα map of the Orion-Eridanus superbubble (Reynolds & Ogden 1979, same region as in Fig. 7). The colour scale is linear and in units of Rayleigh (4π × 10-4 photons cm-2 s-1 sr-1). A galactic coordinate system is indicated with degree labels in green. The projection is area-conserving and centred on the Galactic anti-centre. The two bright regions near (l,b) = ( − 208, − 18) are the Orion clouds. The bright arc towards the top left of the Orion clouds is Barnard’s loop, probably a shell due energy injection from the Orion clouds. It delineates the extent of the superbubble towards the Galactic plane. The arc-like features towards the bottom of the map may also be related to the shell and delimit the X-ray emission (compare Fig. 7). The shell is also traced in HI (Brown et al. 1995).
Current usage metrics show cumulative count of Article Views (full-text article views including HTML views, PDF and ePub downloads, according to the available data) and Abstracts Views on Vision4Press platform.
Data correspond to usage on the plateform after 2015. The current usage metrics is available 48-96 hours after online publication and is updated daily on week days.
Initial download of the metrics may take a while.