Fig. 7
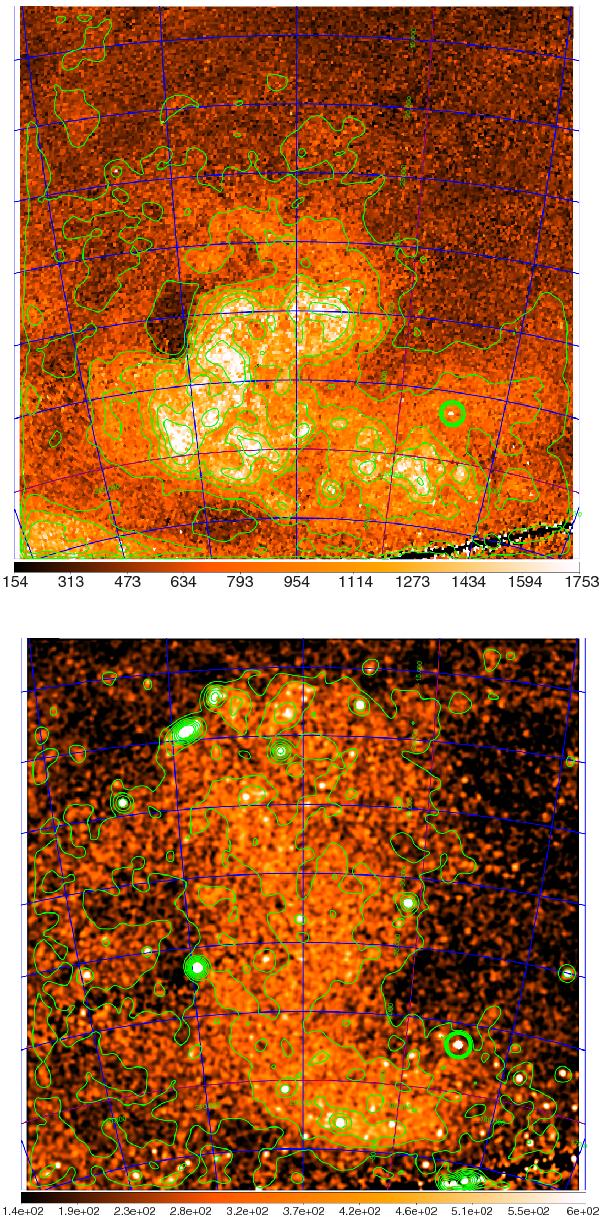
X-ray maps of the Orion-Eridanus superbubble (same region as in Fig. 8) in the 0.1–0.4 keV (top, contour levels: 700, 900, 1100, 1300, 1500, 1900) and the 0.5–2 keV (bottom, contour levels: 220, 300, 380, 460, 540, 620, 700) bands from the ROSAT all-sky survey (Snowden et al. 1997). The colour scale units are 10-6 counts arcmin-2 s-1. The scale is linear and does not start at zero in order to de-emphasise unrelated background. The X-ray emission of the superbubble interior is delineated by shells seen in Hα (compare Fig. 8). The softer and harder X-ray bands emphasise gas at different temperature. We propose that this may relate to a global oscillation of the superbubble, similar as seen in the simulations.
Current usage metrics show cumulative count of Article Views (full-text article views including HTML views, PDF and ePub downloads, according to the available data) and Abstracts Views on Vision4Press platform.
Data correspond to usage on the plateform after 2015. The current usage metrics is available 48-96 hours after online publication and is updated daily on week days.
Initial download of the metrics may take a while.