Fig. 6
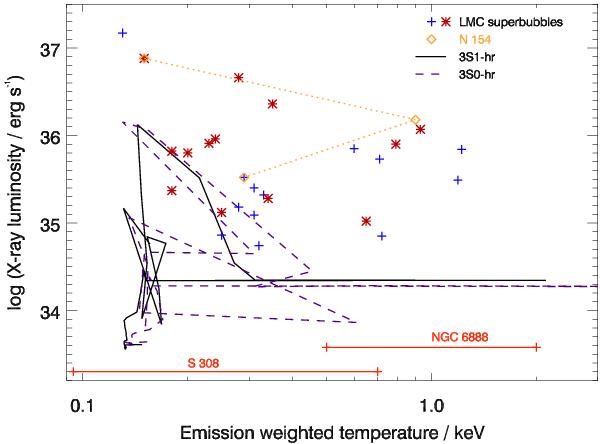
Luminosity-temperature diagram for run 3S1-hr (solid black line), shown in Fig. 1, and for run 3S0-hr, where the massive stars are all co-spatial. For this comparison, the X-ray luminosity is integrated between 0.1 and 2.4 keV corresponding to the ROSAT PSPC instrument. The temperature is the average temperature of the superbubble weighted by the emission measure. This is compared to the data of a sample of LMC superbubbles observed with ROSAT by Dunne et al. (2001, red stars and the blue pluses correspond to the same sample but different absorption corrections). The light-orange diamonds connected by the dotted line correspond to different measurements for the bubble N 154 in the LMC. The two lower temperature measurements are from ROSAT. The higher temperature measurement is from Sasaki et al. (2011) with XMM-Newton . This gives an idea of the observational uncertainty. We also show data for the two X-ray-detected Wolf-Rayet bubbles, S308 (Toalá et al. 2012) and NGC 6888 (Zhekov & Park 2011).
Current usage metrics show cumulative count of Article Views (full-text article views including HTML views, PDF and ePub downloads, according to the available data) and Abstracts Views on Vision4Press platform.
Data correspond to usage on the plateform after 2015. The current usage metrics is available 48-96 hours after online publication and is updated daily on week days.
Initial download of the metrics may take a while.