Fig. A.1
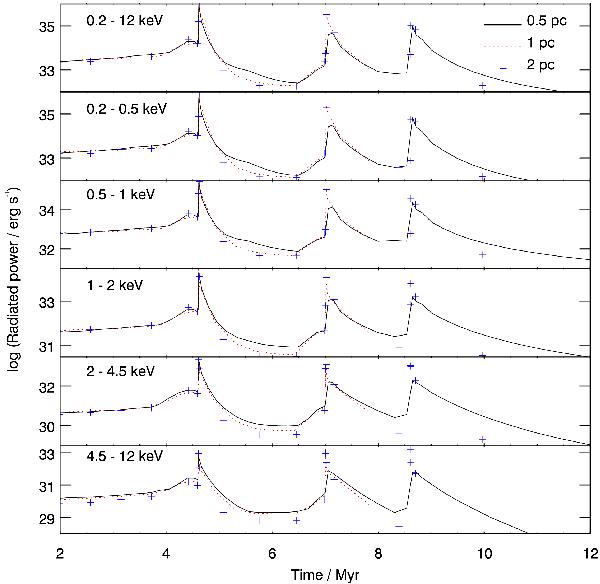
Integrated X-ray luminosity over time for different spatial resolutions and different energy bands indicated in the respective individual plots. The solid black line is for the highest resolution run, shown in Fig. 1 (0.5 pc resolution for finest AMR level). The dotted red curve is for a twice coarser grid, the blue pluses for again a factor of two worse resolution.
Current usage metrics show cumulative count of Article Views (full-text article views including HTML views, PDF and ePub downloads, according to the available data) and Abstracts Views on Vision4Press platform.
Data correspond to usage on the plateform after 2015. The current usage metrics is available 48-96 hours after online publication and is updated daily on week days.
Initial download of the metrics may take a while.