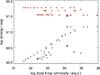
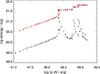
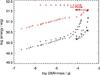
Fig. 11
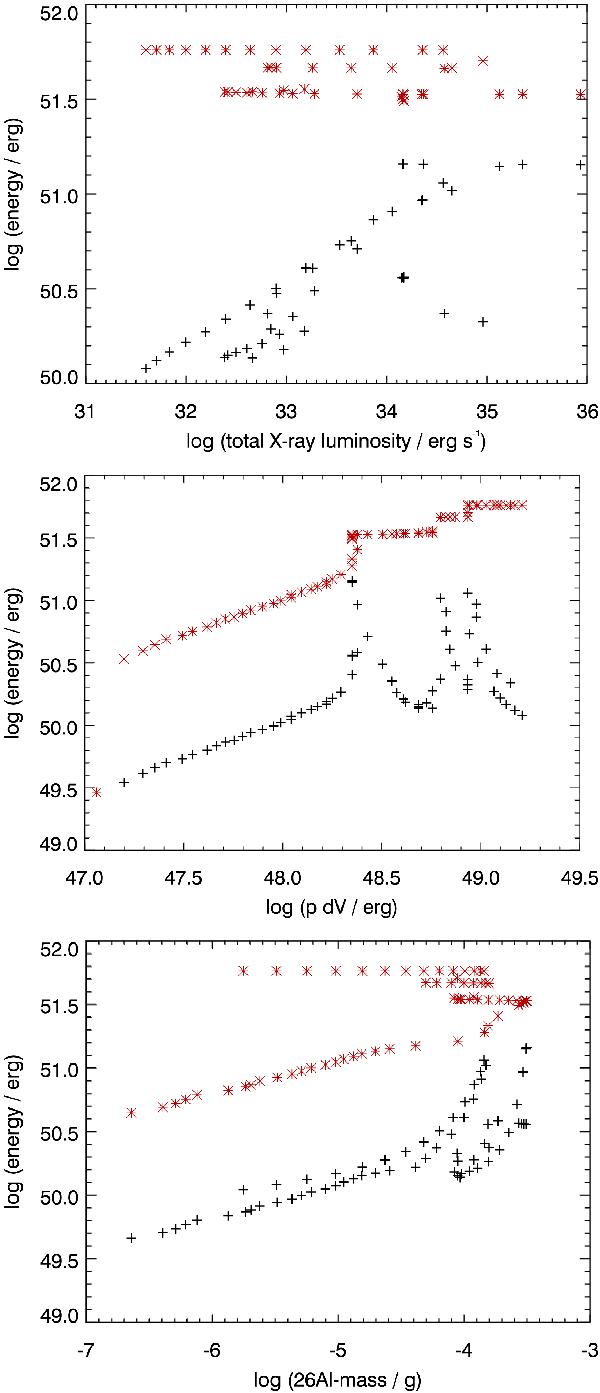
Scatter plots of the cumulative input energy (red stars) and the total current energy (black pluses), both at a given time, over a potential tracer on the horizontal axis for the representative simulation 3S1-hr. For the latter, we use the X-ray luminosity (top), the work against the ambient pressure (middle), and the mass of the radioactive isotope 26Al. See text for details.
Current usage metrics show cumulative count of Article Views (full-text article views including HTML views, PDF and ePub downloads, according to the available data) and Abstracts Views on Vision4Press platform.
Data correspond to usage on the plateform after 2015. The current usage metrics is available 48-96 hours after online publication and is updated daily on week days.
Initial download of the metrics may take a while.