Fig. 6
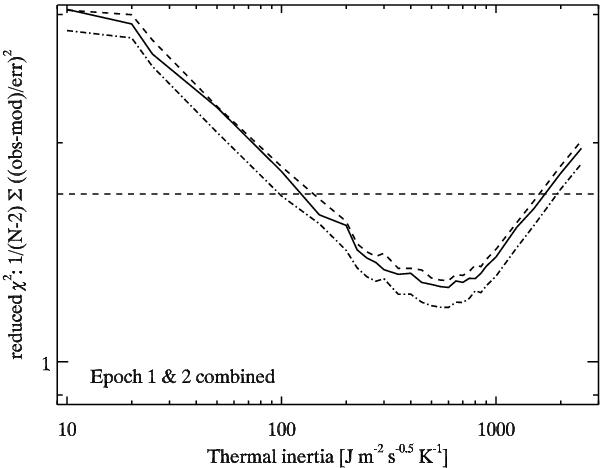
Reduced χ2-values calculated for the radiometric analysis of the combined epoch-1 and epoch-2 data set. The dashed line shows the low-roughness case, while the dashed-dotted line represents the very high roughness case. Good-fit solutions are found below the dashed horizontal line, which represents the reduced χ2 threshold for five measurements at 1.7.
Current usage metrics show cumulative count of Article Views (full-text article views including HTML views, PDF and ePub downloads, according to the available data) and Abstracts Views on Vision4Press platform.
Data correspond to usage on the plateform after 2015. The current usage metrics is available 48-96 hours after online publication and is updated daily on week days.
Initial download of the metrics may take a while.