Free Access
Fig. 4
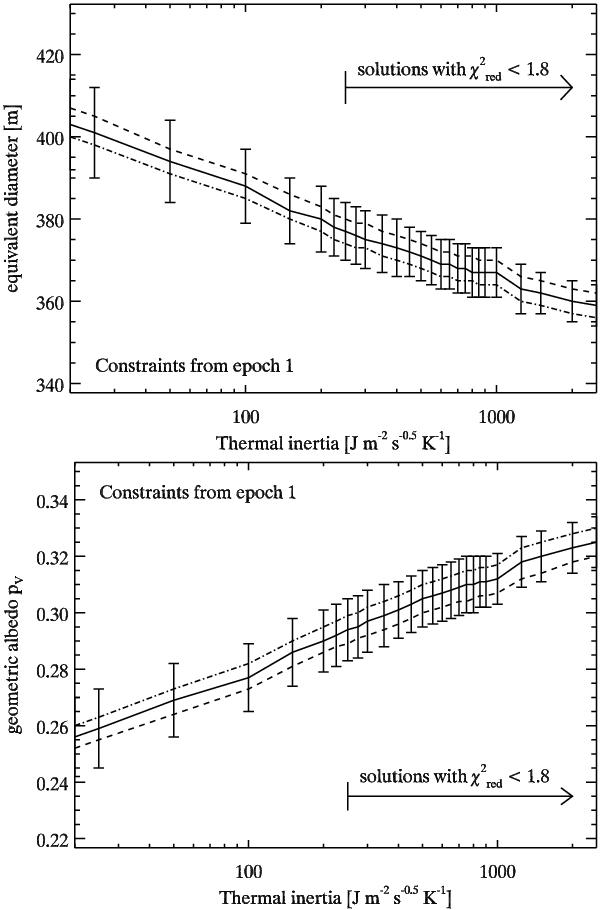
Radiometrically derived size (top) and albedo (bottom) as a function of thermal inertia. The influence of model surface roughness is shown as dashed (low roughness) and dotted-dashed (high roughness) lines. The errorbars indicate the standard deviation of observation-to-model ratios for our epoch-1 measurements.
This figure is made of several images, please see below:

Current usage metrics show cumulative count of Article Views (full-text article views including HTML views, PDF and ePub downloads, according to the available data) and Abstracts Views on Vision4Press platform.
Data correspond to usage on the plateform after 2015. The current usage metrics is available 48-96 hours after online publication and is updated daily on week days.
Initial download of the metrics may take a while.