Fig. 3

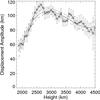
Measured wave properties. The left panel displays the measured displacement amplitude (stars) as a function of height in the atmosphere relative to τ5000 = 1. The vertical bars shows the σ error on the measured quantity. The solid black line corresponds to the cubic fit to the amplitude profile and the dashed lines show the 2σ (95%) confidence level of the fit. The middle panel displays the lag value measured from cross-correlation of neighbouring time-distance diagrams separated by 40 km (red stars) and 80 km (black diamonds). The red and black solid lines are the corresponding exponential fits to measured lags. The right hand panel displays the phase speed calculated from the fits to the lag data points. The red and black dashed lines correspond to the σ confidence levels for the phase speeds.
Current usage metrics show cumulative count of Article Views (full-text article views including HTML views, PDF and ePub downloads, according to the available data) and Abstracts Views on Vision4Press platform.
Data correspond to usage on the plateform after 2015. The current usage metrics is available 48-96 hours after online publication and is updated daily on week days.
Initial download of the metrics may take a while.


