Fig. 9
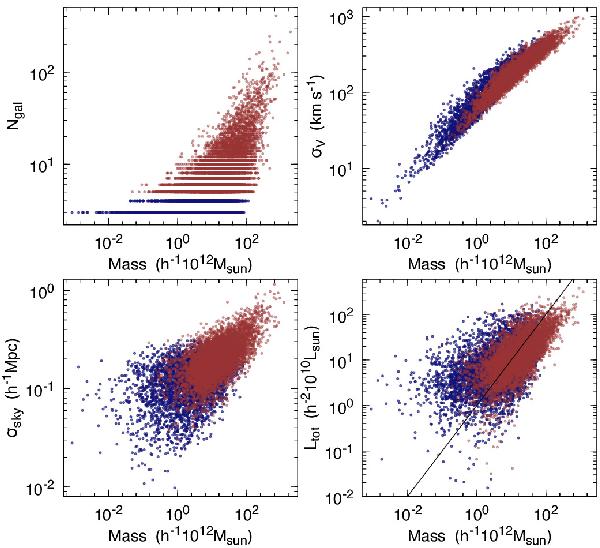
Flux-limited group masses versus group properties: upper left panel: group richness; upper right: velocity dispersion; lower left: group extent; lower right: group total luminosity. Blue points denote small groups (fewer than 5 members) and red dots denote larger groups. Galaxy pairs are not shown.
Current usage metrics show cumulative count of Article Views (full-text article views including HTML views, PDF and ePub downloads, according to the available data) and Abstracts Views on Vision4Press platform.
Data correspond to usage on the plateform after 2015. The current usage metrics is available 48-96 hours after online publication and is updated daily on week days.
Initial download of the metrics may take a while.