Fig. 6
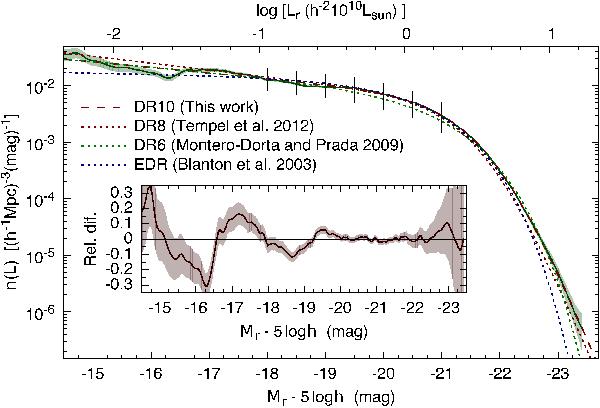
Galaxy luminosity function in the r-filter. The solid line and the shaded region show the measured luminosity function together with the 99.7% confidence limit (corresponds to 3σ). The dashed line shows the best-fit double power-law fit. Dotted lines show previous approximations by Blanton et al. (2003, EDR), Montero-Dorta & Prada (2009, DR6), and Tempel et al. (2012, DR8). The former two are approximations with Schechter functions. The inset panel shows the relative difference between the best-fit double power-law function and the measured luminosity function. Vertical lines show the magnitude limits for the volume-limited samples.
Current usage metrics show cumulative count of Article Views (full-text article views including HTML views, PDF and ePub downloads, according to the available data) and Abstracts Views on Vision4Press platform.
Data correspond to usage on the plateform after 2015. The current usage metrics is available 48-96 hours after online publication and is updated daily on week days.
Initial download of the metrics may take a while.