Fig. 5
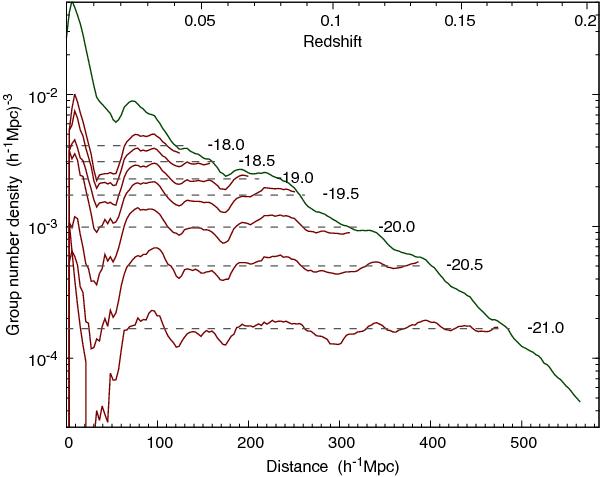
Group number density as a function of distance for flux- and volume-limited samples. The green line shows the flux-limited sample, red lines show different volume-limited samples. Dashed lines give the average number density for the volume-limited samples (the values are given in Table 1). The density minimum at lower distances is caused by the low statistics and a small volume.
Current usage metrics show cumulative count of Article Views (full-text article views including HTML views, PDF and ePub downloads, according to the available data) and Abstracts Views on Vision4Press platform.
Data correspond to usage on the plateform after 2015. The current usage metrics is available 48-96 hours after online publication and is updated daily on week days.
Initial download of the metrics may take a while.