Fig. 3
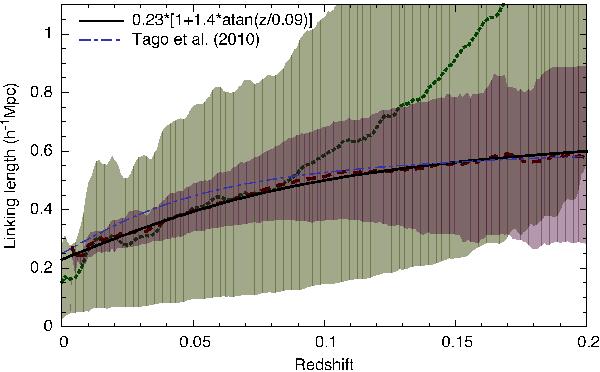
FoF LL (in physical coordinates) as a function of redshift. The dotted green line shows the mean distance to the nearest neighbouring galaxy in physical coordinates with 68% confidence limits (green region). The dashed red line shows the LL scaling derived after shifting the nearby groups to larger distances, together with 68% confidence limits (red region). The solid black line shows the best fit to the scaling relation. The dot-dashed blue line shows the scaling from Tago et al. (2010).
Current usage metrics show cumulative count of Article Views (full-text article views including HTML views, PDF and ePub downloads, according to the available data) and Abstracts Views on Vision4Press platform.
Data correspond to usage on the plateform after 2015. The current usage metrics is available 48-96 hours after online publication and is updated daily on week days.
Initial download of the metrics may take a while.