Fig. C.2
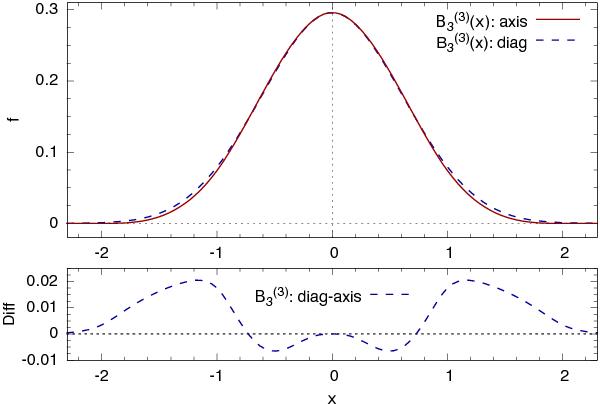
Deviation from isotropy for the 3D B3 spline kernel. Upper panel shows the B3 distribution for two extreme cases: along the coordinate axis and along the diagonal of the box. The lower panel shows the difference (in units of the central density) between these extremes. The maximum deviation from isotropy is lower than two per cent.
Current usage metrics show cumulative count of Article Views (full-text article views including HTML views, PDF and ePub downloads, according to the available data) and Abstracts Views on Vision4Press platform.
Data correspond to usage on the plateform after 2015. The current usage metrics is available 48-96 hours after online publication and is updated daily on week days.
Initial download of the metrics may take a while.