Fig. 10
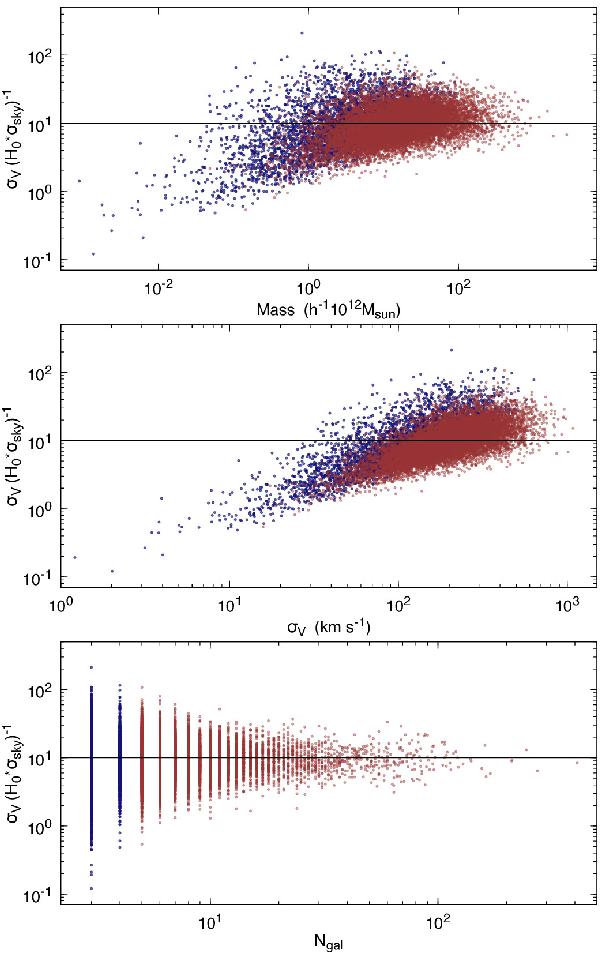
Group shape in the redshift space (ratio of velocity dispersion to the group extent in the sky) as a function of group mass (upper panel), velocity dispersion (middle panel), and group richness (lower panel). Blue points show poor groups (fewer than five members) and red dots show richer groups.
Current usage metrics show cumulative count of Article Views (full-text article views including HTML views, PDF and ePub downloads, according to the available data) and Abstracts Views on Vision4Press platform.
Data correspond to usage on the plateform after 2015. The current usage metrics is available 48-96 hours after online publication and is updated daily on week days.
Initial download of the metrics may take a while.