Fig. 8
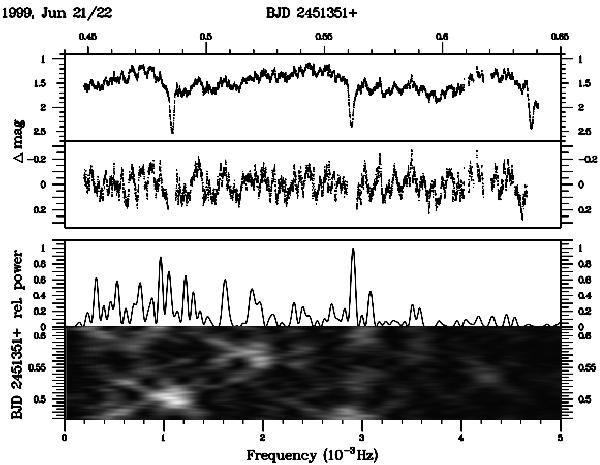
V893 Sco during the night of 1999 June 21/22. Top panel: differential light curve (variable – comparison star C1). Second panel: same as top panel, but after removal of eclipses and variations on timescales >15m. Third panel: Lomb-Scargle periodogram of the light curve shown in the second panel. Lower panel: stacked Lomb-Scargle periodograms of sliding sections of the light curve of panel two (see text for details).
Current usage metrics show cumulative count of Article Views (full-text article views including HTML views, PDF and ePub downloads, according to the available data) and Abstracts Views on Vision4Press platform.
Data correspond to usage on the plateform after 2015. The current usage metrics is available 48-96 hours after online publication and is updated daily on week days.
Initial download of the metrics may take a while.