Fig. 6
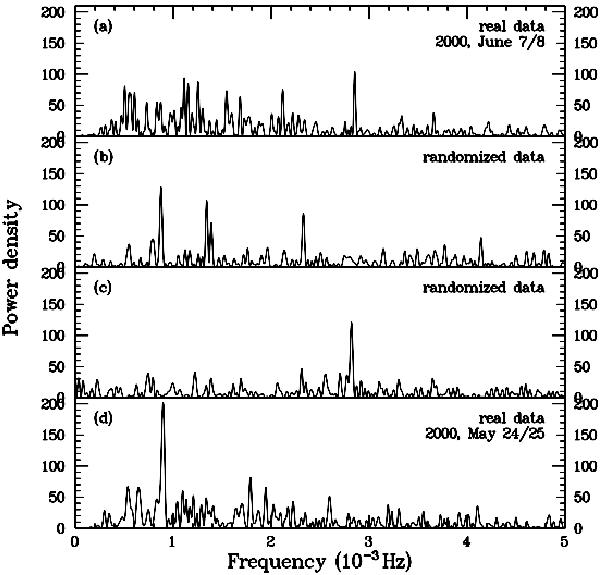
Panel a) power spectrum of the original light curve of 2000 June 7/9, after removal of the eclipses and variations on timescales longer than ≈15m. Panel b) power spectrum of the randomized light curve with the highest peak in 10 000 trials. Panel c) power spectrum of the randomized light curve with the largest contrast between the highest and the second highest peak. Panel d) power spectrum of the original light curve of 2000 May 24/25. See text for details.
Current usage metrics show cumulative count of Article Views (full-text article views including HTML views, PDF and ePub downloads, according to the available data) and Abstracts Views on Vision4Press platform.
Data correspond to usage on the plateform after 2015. The current usage metrics is available 48-96 hours after online publication and is updated daily on week days.
Initial download of the metrics may take a while.