Fig. 12
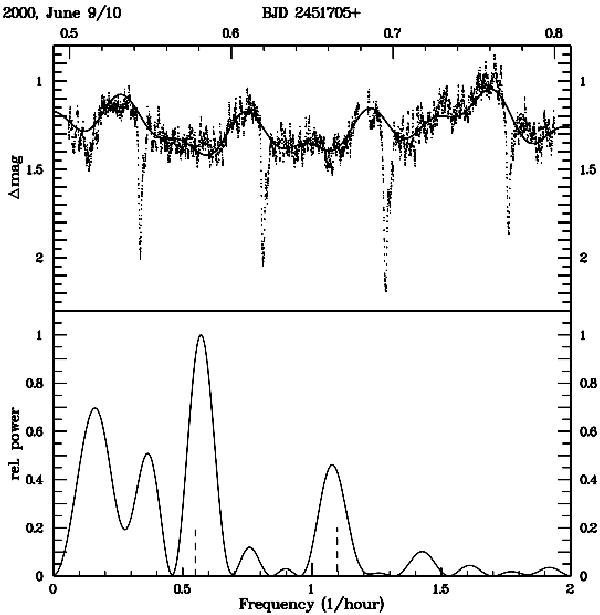
Top: differential light curve of V893 Sco of the night of 2000 June 9/10. Bottom: low frequency part of the power spectrum of the light curve, after masking the eclipses. The orbital frequency and its first harmonic are marked by dashed vertical lines. The solid line in the upper frame is a 4 term sine fit (eclipses masked) with periods fixed to the values corresponding to the dominant peaks in the power spectrum.
Current usage metrics show cumulative count of Article Views (full-text article views including HTML views, PDF and ePub downloads, according to the available data) and Abstracts Views on Vision4Press platform.
Data correspond to usage on the plateform after 2015. The current usage metrics is available 48-96 hours after online publication and is updated daily on week days.
Initial download of the metrics may take a while.