Free Access
Fig. 5
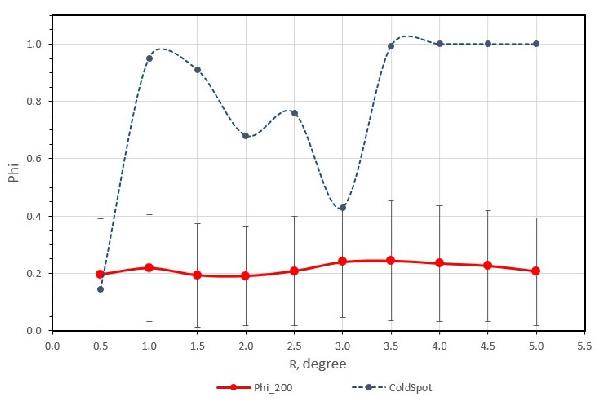
Dependence of Φ vs. the radius for the cold spot for 100 GHz data and for 200 regions of simulated Gaussian map of the parameters of the 100 GHz map (more in the text).
Current usage metrics show cumulative count of Article Views (full-text article views including HTML views, PDF and ePub downloads, according to the available data) and Abstracts Views on Vision4Press platform.
Data correspond to usage on the plateform after 2015. The current usage metrics is available 48-96 hours after online publication and is updated daily on week days.
Initial download of the metrics may take a while.