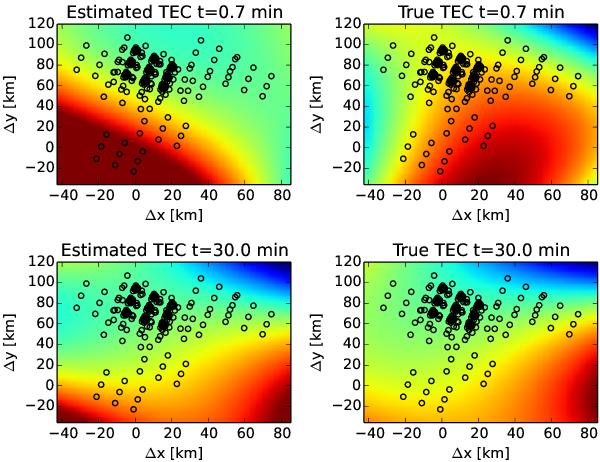
Fig. 5

Ionosphere state described using a Legendre polynomial basis function. The estimated and true state of the ionosphere (left and right panels) are shown at the beginning and at the end of the filter’s recursion. The open circles show the location of the pierce points in the ionosphere. The spatial coordinates are given in kilometers from the array center projected on the ionosphere screen.
Current usage metrics show cumulative count of Article Views (full-text article views including HTML views, PDF and ePub downloads, according to the available data) and Abstracts Views on Vision4Press platform.
Data correspond to usage on the plateform after 2015. The current usage metrics is available 48-96 hours after online publication and is updated daily on week days.
Initial download of the metrics may take a while.


