Free Access
Fig. 4
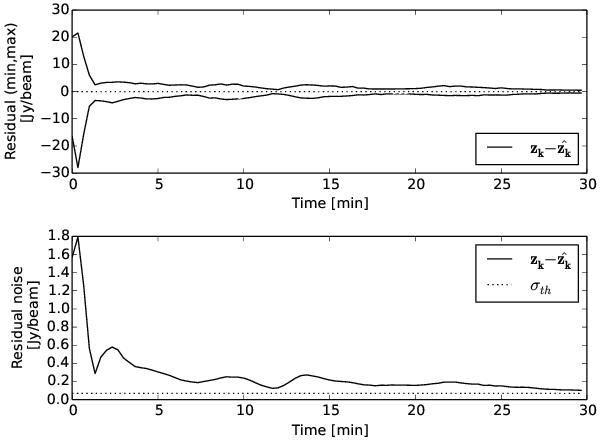
Top panel: maximum and minimum residual values in the snapshot image as a function of recursion time (full line). Bottom panel: standard deviation in the residual snapshot maps. The expected thermal noise is shown in the bottom figure as the dotted line.
Current usage metrics show cumulative count of Article Views (full-text article views including HTML views, PDF and ePub downloads, according to the available data) and Abstracts Views on Vision4Press platform.
Data correspond to usage on the plateform after 2015. The current usage metrics is available 48-96 hours after online publication and is updated daily on week days.
Initial download of the metrics may take a while.