Fig. 1
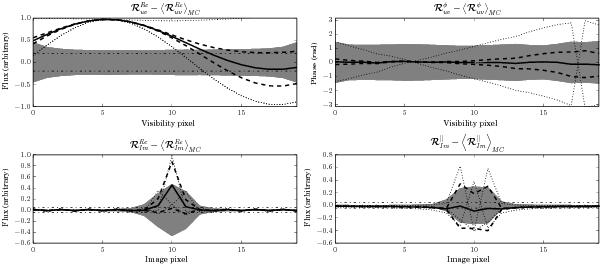
This figure shows how the sigma-point statistics compares to the true statistics. Specifically, we consider the case of a frequency-dependent phase gradient (clock offset, ionospheric effect, or source position offset). The true covariance corresponds to the gray area, while the sigma points appear as dotted lines, together with their associated estimated covariance (thick dashed line). The noise in the data is represented by the dash-dotted line. Qualitatively, the goodness of the description depends on the type of the data representations operator.
Current usage metrics show cumulative count of Article Views (full-text article views including HTML views, PDF and ePub downloads, according to the available data) and Abstracts Views on Vision4Press platform.
Data correspond to usage on the plateform after 2015. The current usage metrics is available 48-96 hours after online publication and is updated daily on week days.
Initial download of the metrics may take a while.