Fig. 3
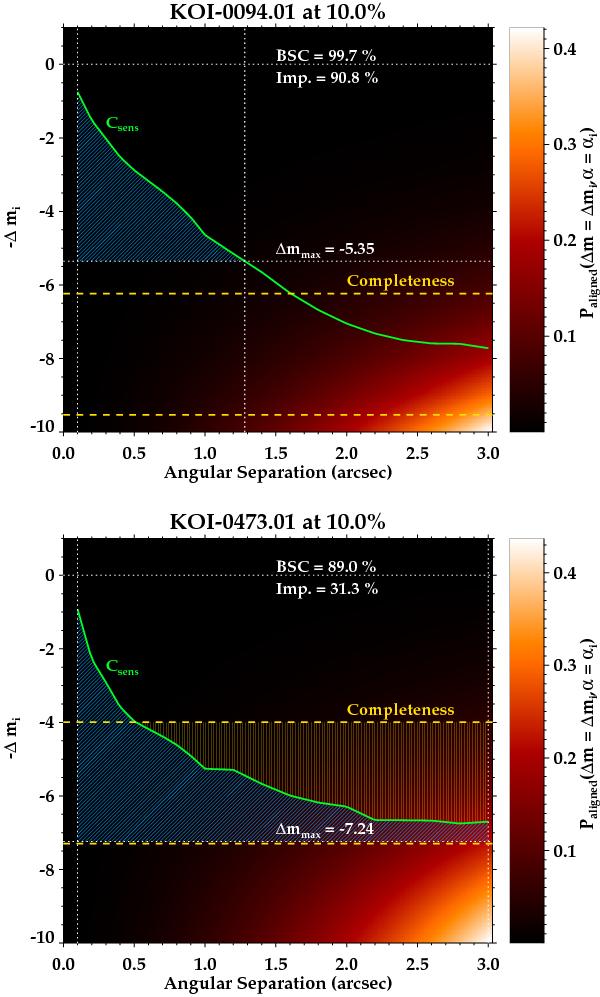
Example of the determination of the BSC parameter (see Sect. 4.1.1) for two KOIs with conclusive (top panel) and non-conclusive (bottom panel) results. The green solid line represents the 5σ sensitivity limit (or sensitivity curve, Csens) for the CAHA/AstraLux image (calculated as explained in Sect. 2.5). The lower horizontal dotted white line represents the maximum magnitude difference Δmmax of a possible eclipsing binary that could mimic the transit signal as expected for these KOIs (see Sect. 4.1.1). The two vertical white dotted lines show the lowest angular separation detectable in the image (left line) and the intersection between the sensitivity curve and the Δmmax (right line). The upper and bottom dashed yellow lines represent the completeness and detectability levels (respectively) for the given KOI. The incompleteness region is marked in the bottom panel by the dashed region with vertical yellow lines. The uncovered region is shadowed with diagonal light blue lines. The background color code in the image represents the probability of having a chance-aligned background source for every angular separation and magnitude difference for the given KOI. The first example corresponds to excellent data (deep enough so that no incomplete region is present), whereas the second example is not deep enough. The Δm = 0 is marked by the upper horizontal dotted line.
Current usage metrics show cumulative count of Article Views (full-text article views including HTML views, PDF and ePub downloads, according to the available data) and Abstracts Views on Vision4Press platform.
Data correspond to usage on the plateform after 2015. The current usage metrics is available 48-96 hours after online publication and is updated daily on week days.
Initial download of the metrics may take a while.