Fig. 1
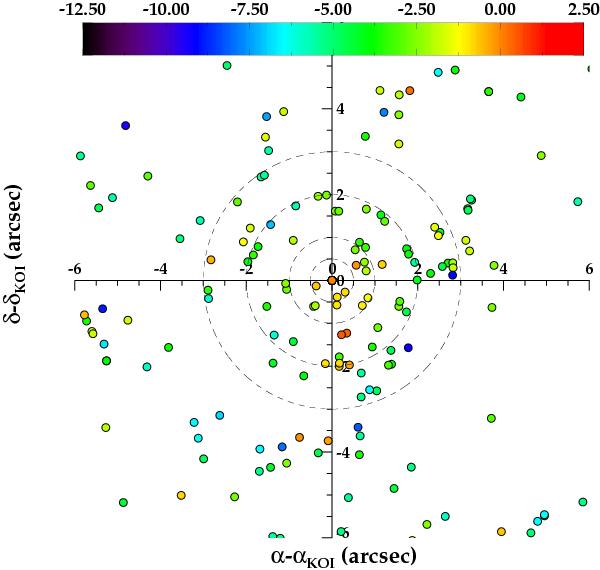
Location of the detected companions to the KOIs in our sample. Each filled circle corresponds to a detected source and its relative position in the projected sky with respect to the KOI. The colors represent the magnitude difference between the companion and the corresponding KOI. We have marked with dashed circles the 0.5, 1.0, 2.0, and 3.0 arcsec separations for visualization purposes.
Current usage metrics show cumulative count of Article Views (full-text article views including HTML views, PDF and ePub downloads, according to the available data) and Abstracts Views on Vision4Press platform.
Data correspond to usage on the plateform after 2015. The current usage metrics is available 48-96 hours after online publication and is updated daily on week days.
Initial download of the metrics may take a while.