Fig. 4
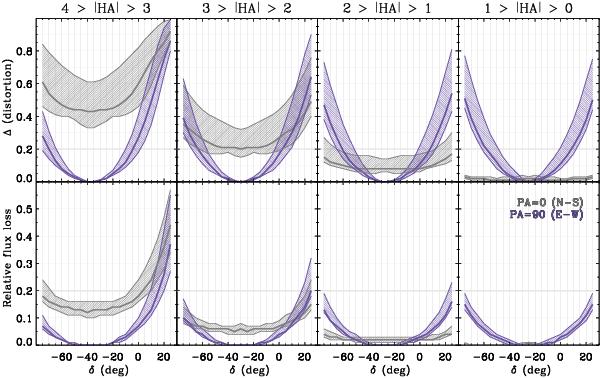
Shaded regions show, for the HR_blue grism, the entire range of spectral distortions (upper row) and flux losses (lower row) for the nine simulated slits as a function of target declination. The corresponding minimum, median and maximum values at fixed declination are indicated by solid lines. The plots show the effects for two different slit orientations at the meridian (N-S in grey and E-W in purple). Each column corresponds to a one-hour-long integration with target hour angle as indicated on top. The thick horizontal lines at 20 per cent indicate our assumed maximum tolerated loss/distortion level.
Current usage metrics show cumulative count of Article Views (full-text article views including HTML views, PDF and ePub downloads, according to the available data) and Abstracts Views on Vision4Press platform.
Data correspond to usage on the plateform after 2015. The current usage metrics is available 48-96 hours after online publication and is updated daily on week days.
Initial download of the metrics may take a while.