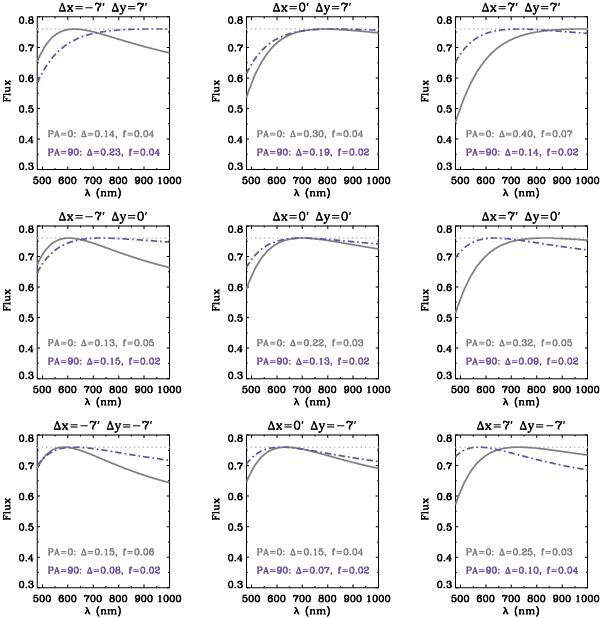
Fig. 3
Output simulated spectra for nine different slit positions across the VIMOS FOV. The relative positions (in arcmin) of the slits with respect to the centre of the FOV are indicated. At the meridian, Δx and Δy correspond to Δα and Δδ, respectively. These are the result of a one-hour-long integration (−3 < HA (h) < − 2) on a δ = 0 deg field using the MR grism. In each panel we show the output spectra for two different slit orientations (solid for N-S, and dot-dashed for E-W). We also provide the corresponding relative flux loss (f) and spectral distortion (Δ). The input spectrum is flat (dotted lines), but its flux is reduced by 24 per cent due to finite seeing and slit width. See text for details.
Current usage metrics show cumulative count of Article Views (full-text article views including HTML views, PDF and ePub downloads, according to the available data) and Abstracts Views on Vision4Press platform.
Data correspond to usage on the plateform after 2015. The current usage metrics is available 48-96 hours after online publication and is updated daily on week days.
Initial download of the metrics may take a while.