Free Access
Fig. 21
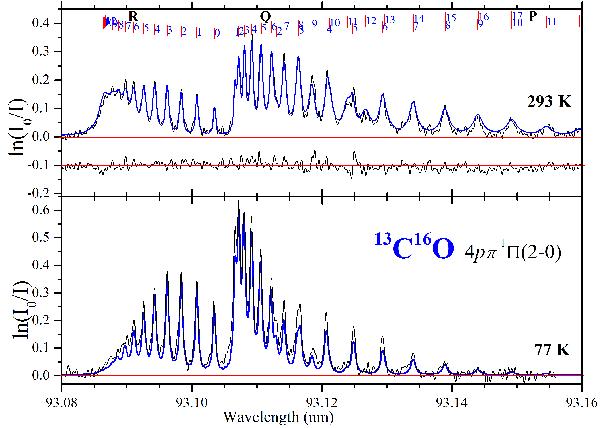
13C16O experimental spectrum (black line) and fit (blue line) of the 4pπ1Π(2–0) band recorded at 293 K (top) with the fitting residuals shifted by − 0.1 and at 77 K (bottom).
Current usage metrics show cumulative count of Article Views (full-text article views including HTML views, PDF and ePub downloads, according to the available data) and Abstracts Views on Vision4Press platform.
Data correspond to usage on the plateform after 2015. The current usage metrics is available 48-96 hours after online publication and is updated daily on week days.
Initial download of the metrics may take a while.