Free Access
Fig. 7
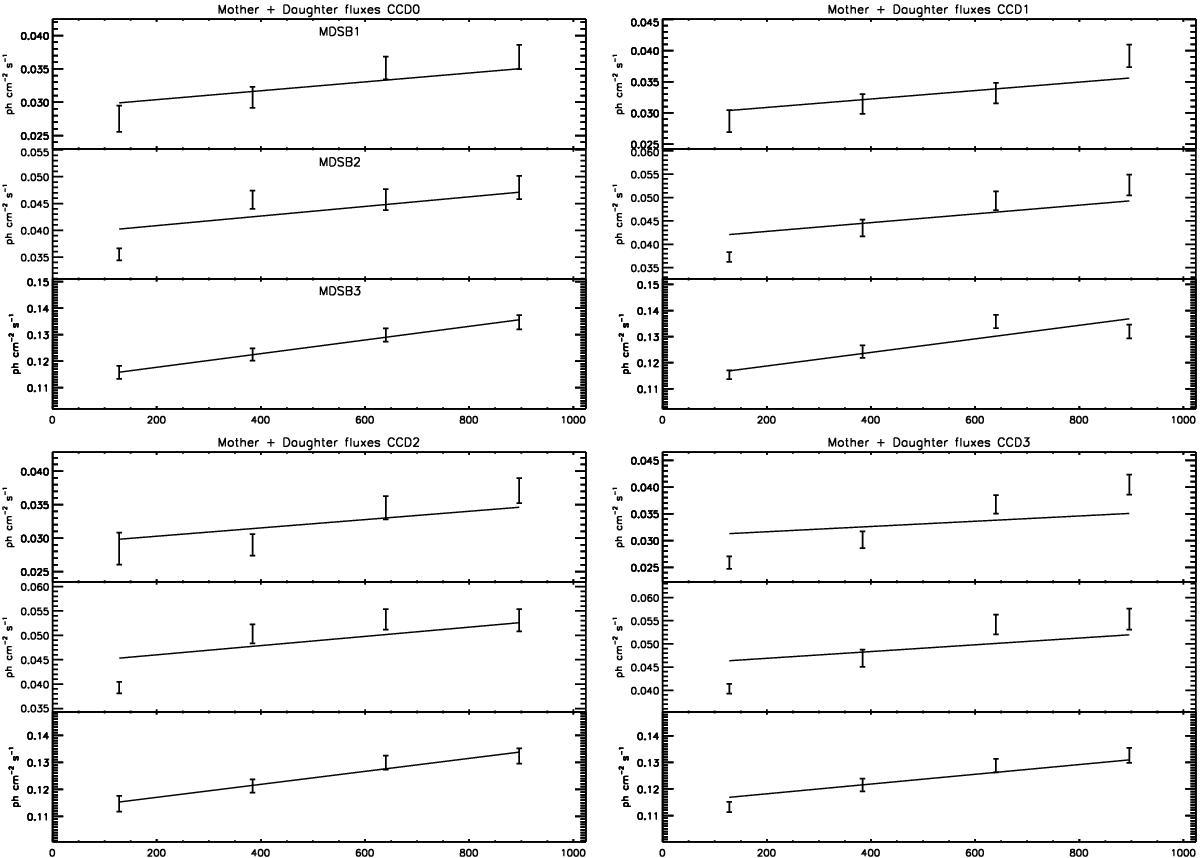
Sum of the fluxes of mother and daughter lines for each MDSB system as a function of y position. Overplotted are the slopes of the continuum gradient reported in Table 2. Each gradient slope has been multiplied by the median value to match the data.
Current usage metrics show cumulative count of Article Views (full-text article views including HTML views, PDF and ePub downloads, according to the available data) and Abstracts Views on Vision4Press platform.
Data correspond to usage on the plateform after 2015. The current usage metrics is available 48-96 hours after online publication and is updated daily on week days.
Initial download of the metrics may take a while.