Free Access
Fig. 6
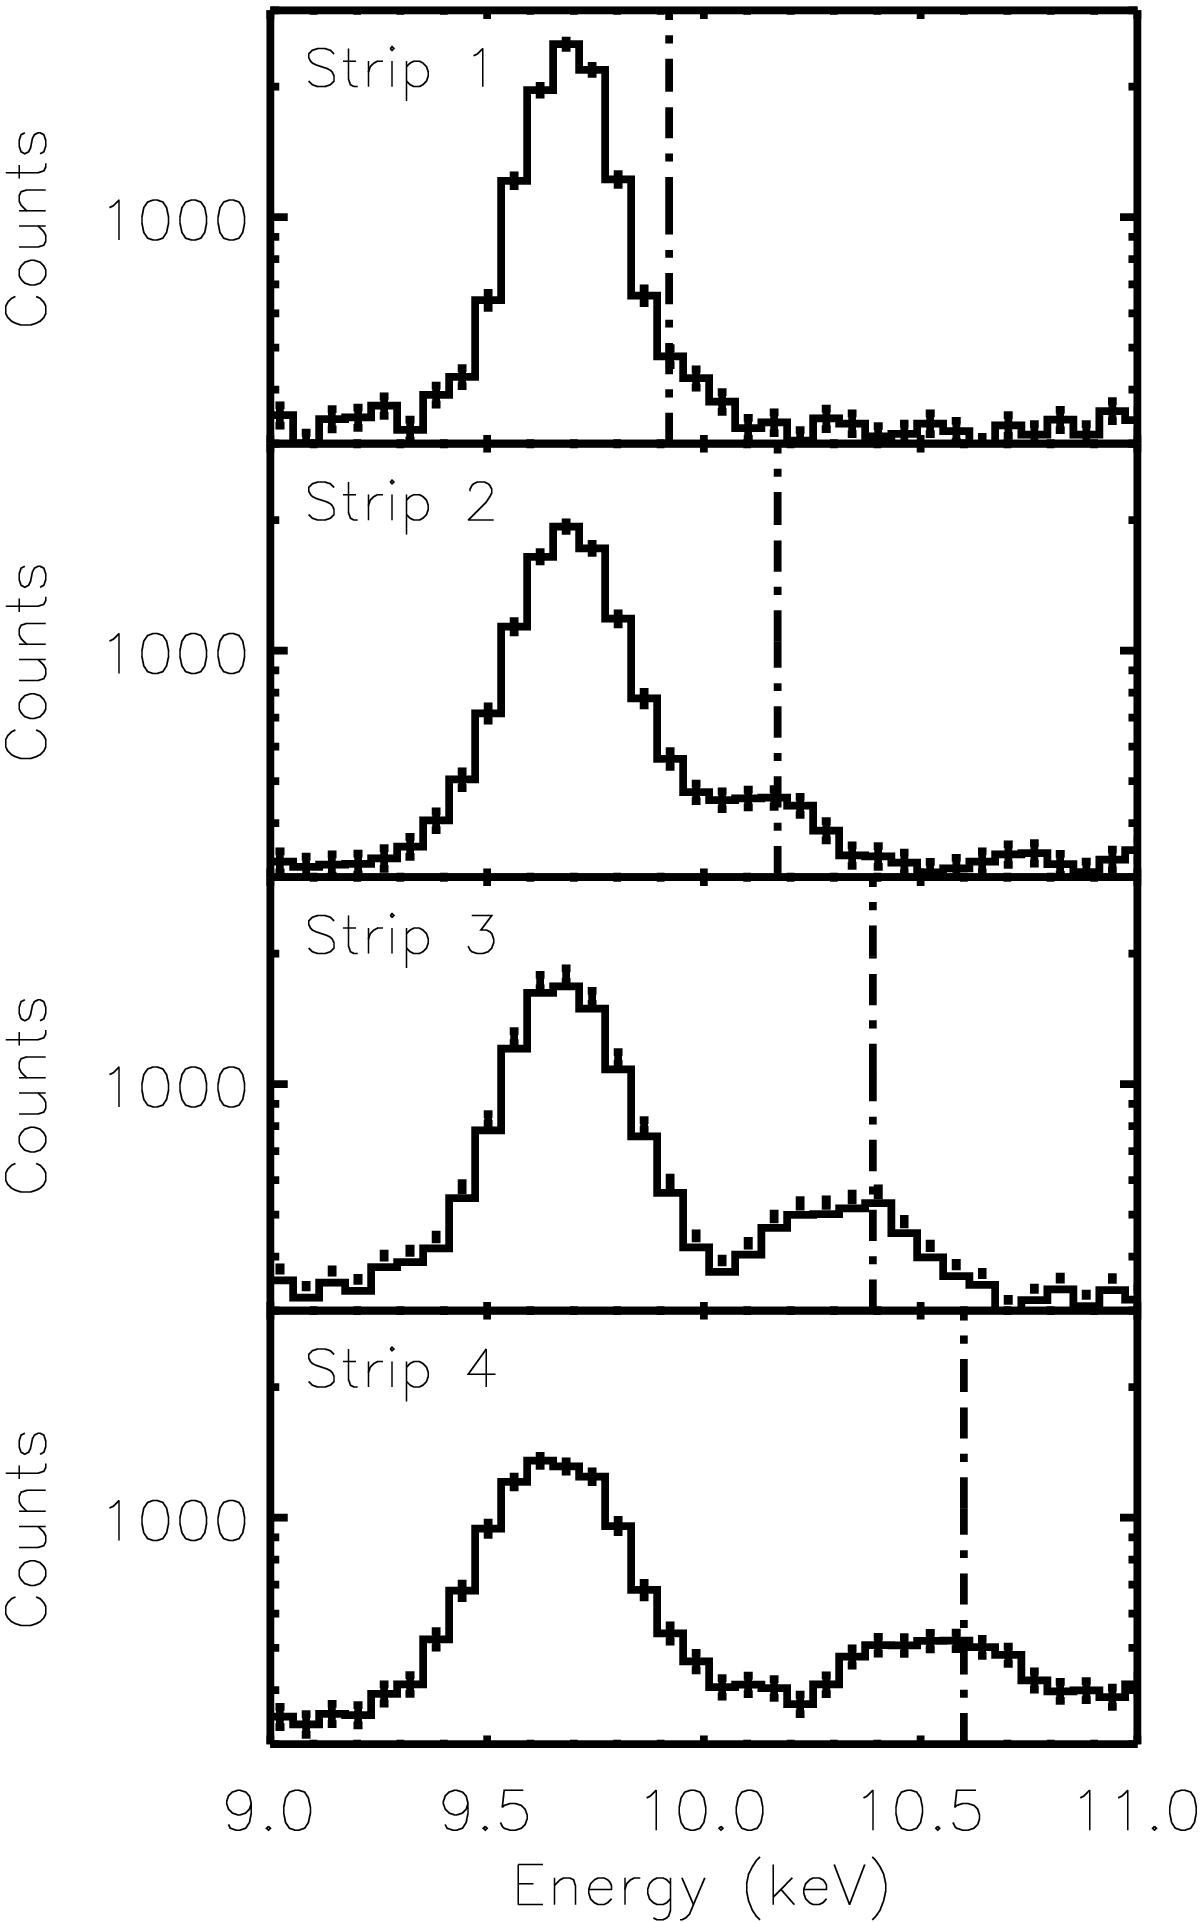
Spectra extracted from the blank-sky dataset of CCD0 in the four analysis strips. From top to bottom we show the spectra from analysis strip 1 to analysis strip 4. The vertical dotted line is the predicted energy position; for details see Sect. 3.2.2.
Current usage metrics show cumulative count of Article Views (full-text article views including HTML views, PDF and ePub downloads, according to the available data) and Abstracts Views on Vision4Press platform.
Data correspond to usage on the plateform after 2015. The current usage metrics is available 48-96 hours after online publication and is updated daily on week days.
Initial download of the metrics may take a while.