Fig. 3
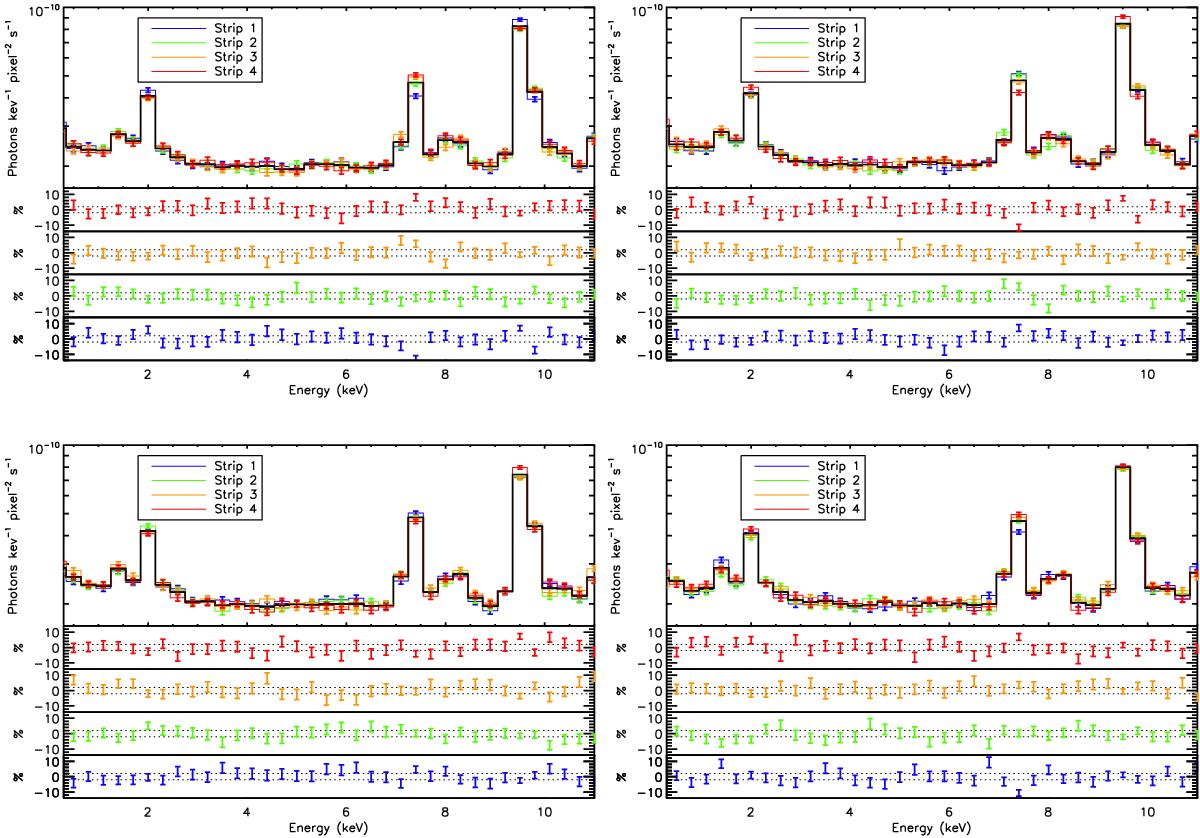
Upper panels: spectra extracted from the four analysis strips along x plotted as a coloured solid line and total spectra represented as a black solid line. Lower panels: percentage variation of the strip spectrum with respect to the total spectrum. Dotted lines are ± 2% lines. In the top-left panel we show the CCD0 spectra, in the top-right panel CCD1, in the bottom-left and bottom-right panels CCD2 and CCD3.
Current usage metrics show cumulative count of Article Views (full-text article views including HTML views, PDF and ePub downloads, according to the available data) and Abstracts Views on Vision4Press platform.
Data correspond to usage on the plateform after 2015. The current usage metrics is available 48-96 hours after online publication and is updated daily on week days.
Initial download of the metrics may take a while.