Fig. 2
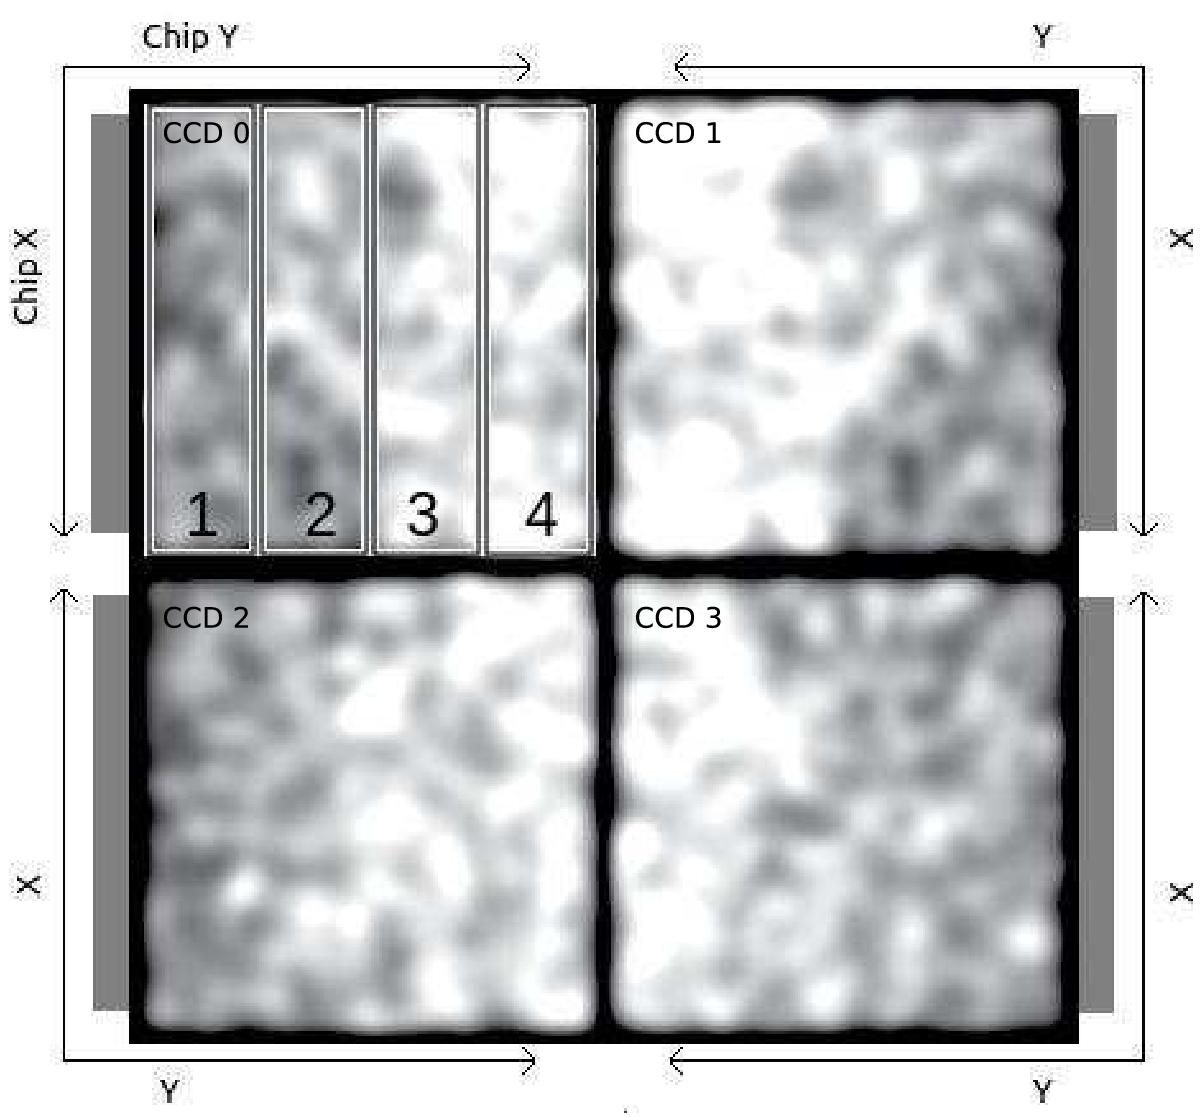
ACIS-I photon image of the stowed dataset of periods D + E in the continuum band in detector coordinates. Darker and lighter patches indicate lower or higher photon number, respectively. The 4 CCDs are divided by the CCD gap in the middle of the image. The upper left square corresponds to CCD0. The image has been binned with detx = 4 and smoothed with a Gaussian kernel with σ = 19 pixels. Grey external rectangles indicate the position of the frame store areas for each ACIS-I chip. The x and y arrows indicate the chip coordinate reference frames for each CCD. The four rectangular areas in CCD0 indicated by increasing number are our analysis strips defined in the text.
Current usage metrics show cumulative count of Article Views (full-text article views including HTML views, PDF and ePub downloads, according to the available data) and Abstracts Views on Vision4Press platform.
Data correspond to usage on the plateform after 2015. The current usage metrics is available 48-96 hours after online publication and is updated daily on week days.
Initial download of the metrics may take a while.