Fig. 15
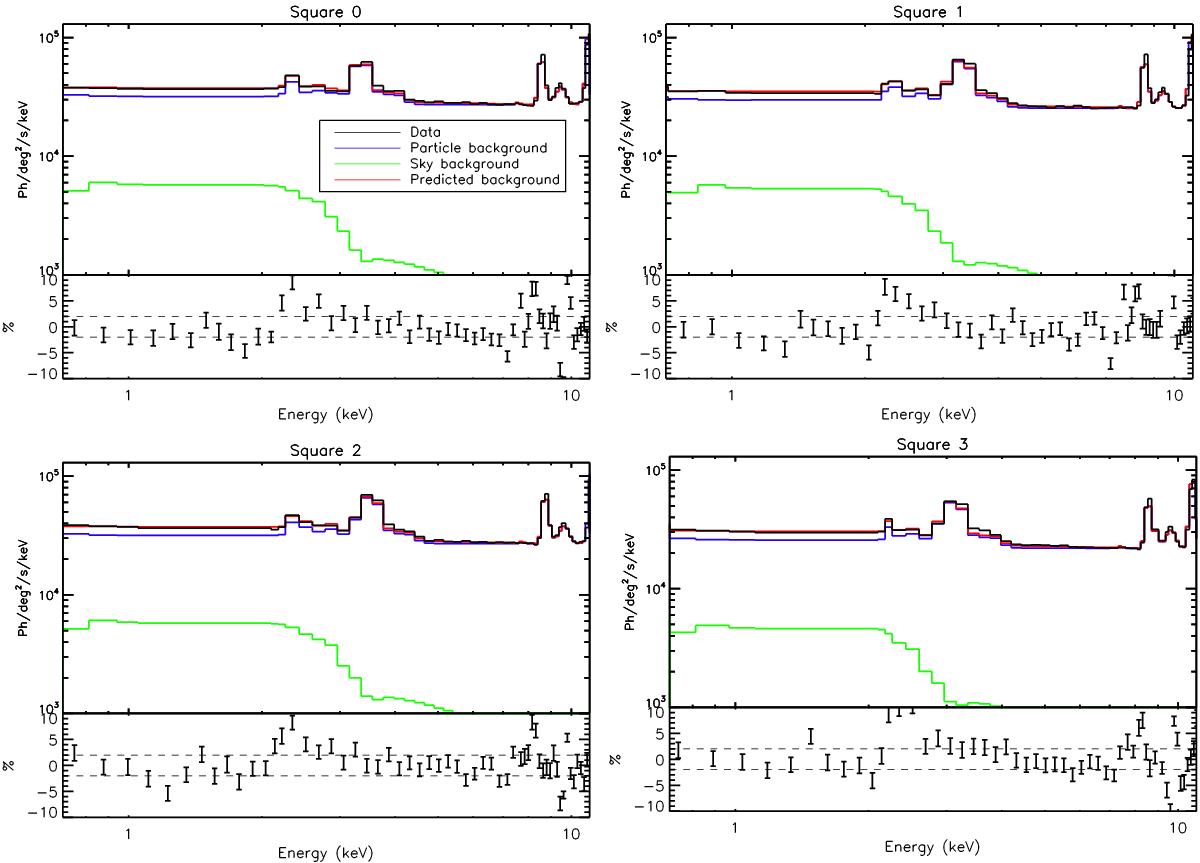
Spectra extracted from the four square regions shown in Fig. 14. Upper part of each panel: the solid black line represents data, the solid blue line the particle background, the green line the sky component, and the red line the total predicted background. Lower part of each panel: percentage variation of the data versus our background model defined as 100 × (data/model−1). Dotted lines indicate the ±2% levels.
Current usage metrics show cumulative count of Article Views (full-text article views including HTML views, PDF and ePub downloads, according to the available data) and Abstracts Views on Vision4Press platform.
Data correspond to usage on the plateform after 2015. The current usage metrics is available 48-96 hours after online publication and is updated daily on week days.
Initial download of the metrics may take a while.